3 Results Analysis 🔍#
When performing a job with the COSMO-RS function, we obtain the following results
Total logarithmic activity coefficient, ln(γ): is the sum of the residual and combinatorial terms. The γ provides a measure of the deviation from ideal behavior in a mixture
ln(γ) > 0 interactions between molecules are weaker than in an ideal solution
ln(γ) < 0 interactions between molecules are stronger than in an ideal solution
Residual logarithmic activity coefficient (Enthalpic Results): takes into account the specific interactions between the segments and shows the difference in energy levels compared to a reference state.
(+) results means that the molecules do not interact as well as they do in the reference state. This makes them more active than you would expect for an ideal solution.
(-) results indicates more favorable interactions than in the reference state, resulting in a lower activity. This could be due to strong specific interactions like hydrogen bonding
Combinatorial logarithmic activity coefficient: comes from the way different molecules in a mixture are shaped and their size. This is based on how much space they take up and their surface area. This term is a way of measuring the randomness of mixing molecules of different sizes. For a system with 2 non-identical molecules, this therm is always positive.
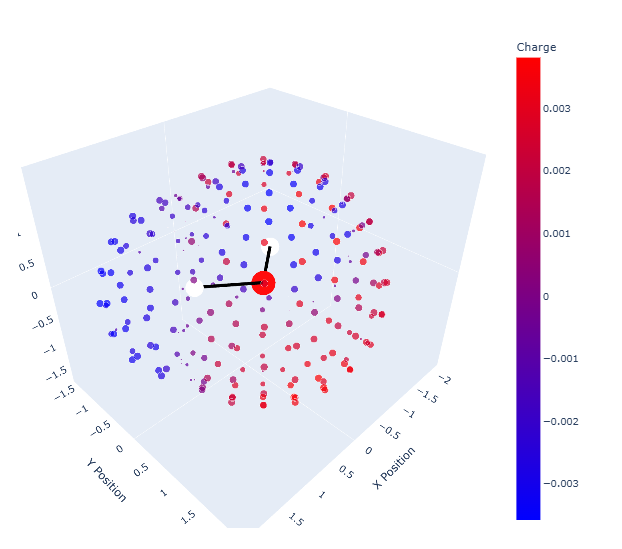
The function plot_3D_segment_location is designed to show the 3D arrangement of molecular segments and atoms from our input file as 3D markers. The size of each marker is proportional to the area of the segment, and its color represents the charge of the segment.
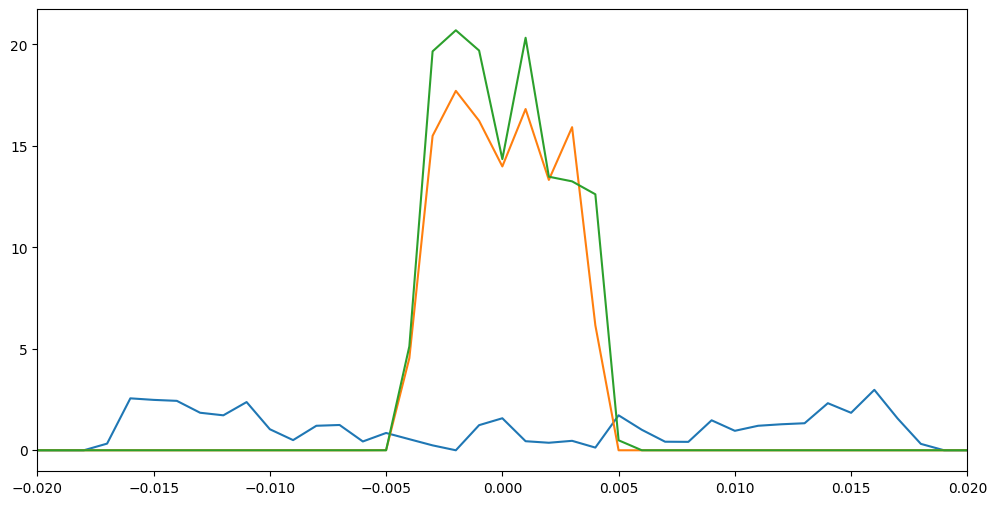
For the functions plot_sigma_profiles & plot_sigma_profiles_plotly , we obtain graph with the following:
X-axis is our sigma or σ, which we already discussed is the screening charge density. The units are elementary charge per square angstrom or e/Ų.
Y-axis is the effective probability function
The sigma profile plot shows how much surface area corresponds to each charge density value. This information is useful for understanding the polarity and interaction potential of molecules, especially in the context of solvation and intermolecular interactions.
Comparing water (polar molecule) with butane and pentane (non-polar), we can see that the density charge is widely distributed around the molecule as in comparison to the other two.
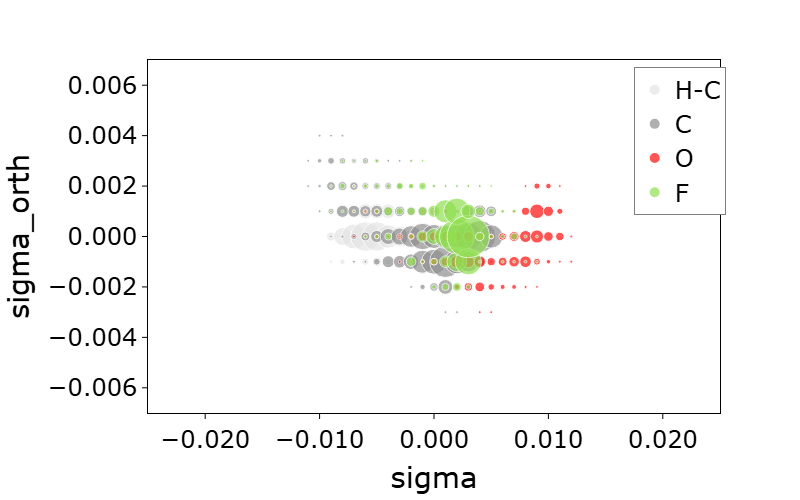
Furthermore, the plot_extended_sigmaprofiles_plotly function, the graph that is displayed has the following characteristics:
X-axis is our sigma or σ, in elementary charge per square angstroms or \(e/10^{⁻20} m^2\). Similar to the x-axis of our previous function
Y-axis is the orthogonal Surface Charge Density in elementary charge per square angstroms, which captures variations in charge density perpendicular to the main charge distribution. It’s a bit like looking at the charge from a different angle. It helps us understand more about how the charge is spread out on the surface.
What Do the Circles Mean?
Each circle shows a small region or area on the surface of the molecule, and their color tells us what kind of atoms are in that region.